Evaluating Graphs with the Measurement Inspector
You can plot the different statistical properties available for graphs, as well as select color ramps and make range selections, in the Measurement Inspector.
To open the Measurement Inspector panel shown below, right-click a graph that contains scalar information and then choose Measurement Inspector in the pop-up menu.
Measurement Inspector

| Item | Description |
|---|---|
| Object | Lets you select the graph, or other object, that you want to adjust in the current 3D view. |
| Scalar type |
Lets you select the scalar type that you want to adjust, as follows:
Edge Scalar Values… Lets you choose a mapping type and measurement for the edges of the selected graph. Vertex Scalar Values… Lets you choose a mapping type and measurement for the vertices of the selected graph. |
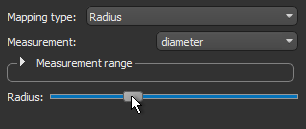
| Mapping type |
Lets you select a mapping type — Radius or LUT — for the selected scalar type.
If you selected Radius as the mapping type, you can adjust the radius of edges and vertices as follows:
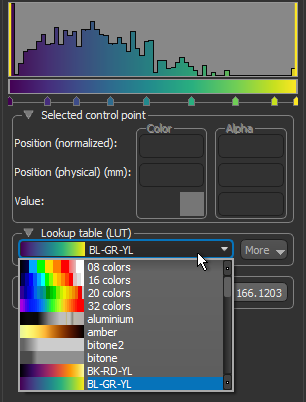
If you selected LUT as the mapping type, you can select a Look-Up Table (LUT) function as follows:
|
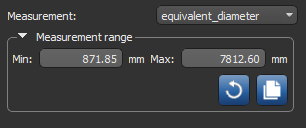
| Measurement | Lets you choose the measurement that you want to apply to the selected scalar type and mapping type. |
| Measurement range |
Indicates the minimum and maximum values of the selected measurement.
If required, you can select the range of data that will be plotted on the histogram as follows:
|
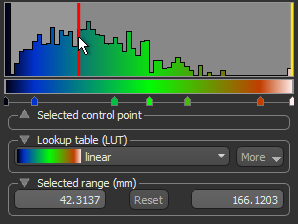
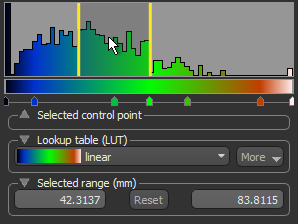
| Histogram |
Shows how values are distributed for the selected measurement and lets you adjust the threshold values for the 'In window' rendering options. You can plot the Y axis in log scale, if required.
|
| Selected range |
The two numbers in this box are the minimum and maximum selected threshold values. These two values define the In window range.
|